But then nobody dares to put all their money in time of uncertainty. The most they’re willing to commit is probably a quarter of their money into the stock market, betting and hoping that the coming earnings result will instill confidence. The current bull could be a sucker’s rally for all you know. Defence Secretary Robert Gates has even advised pulling the plug on spending more billions into futuristic yet super-expensive F-22 Raptor jet fighters which costs a whopping $140 million apiece. The Obama administration’s Pentagon Chief said Pentagon won’t continue the F-22 program beyond 187 planes to which the contractor, Lockheed, retaliated that the plan could slash almost 95,000 jobs.
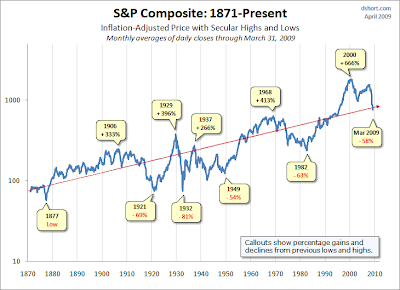
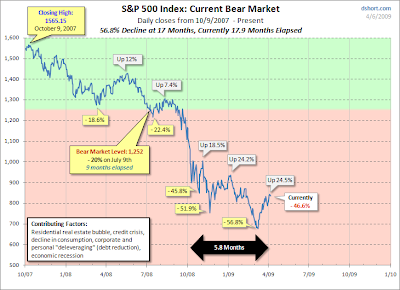
Anyway, regardless whether the worst is indeed over or it was just another trap to suck you into the black-hole investors are revisiting the history’s data for technical charts to decide if the time is ripe to do the right thing. Looking back at the 140-year of bull and bear markets, indeed you can learn a lot from it. No wonder investors and punters are so obsessed with catching the falling knives. Tell me what you can see from the charts below. Do you see Bull? Do you see Bear?

No comments:
Post a Comment